Crude Mortality
One measure of disease outcome is mortality. This is really a measure of incidence, but the new cases that we are focusing on are cases of death. Looking at deaths from all causes in one year over the entire population in that year (measured in the middle of the year) is called crude mortality.
Specific Mortality
There are several other measures of mortality in addition to crude.
- age-specific mortality rates look at the mortality in a specified age group, the numerator and denominator only include people within that age group
- similarly, sex-specific mortality rates look at the mortality of people of a particular gender, this would include all the people who died of that particular sex over all the people of that particular sex
- case-fatality rates look at the mortality of people dying from a disease over all the people who have that disease. This is a measure of the severity of that disease
- disease-specific mortality rates look at the mortality of people with a particular disease, but this time over all people in the population
- proportionate mortality compares mortality of one cause to all other causes, the numerator is death from a particular cause over death from all possible causes.
Years of Potential Life Lost
Most measures of mortality weight the death of an old person the same as a young person. By using YPLL, more weight is given to younger people as they have lost more years of their life. This is a measure of premature mortality.
Direct Age Adjustment
When you have two different populations, with different distributions of age groups, you can’t compare their mortality rates. If there are more old people in one group than the other, this can artificially skew the numbers. Luckily we have a way around this – age adjustments. To calculate direct age adjustments, you’ll want to do three steps:
- STEP ONE: Use a standardized population – in the past, this has been the 1940’s population, recently changed to the 2000 population. Here we are adding the two populations together to create a standard reference population.
- STEP TWO: Apply the age-specific rates of each group to the standard population. This will create new numbers of deaths for each age-group.
- STEP THREE: Add the numbers of each age group and calculate new mortality rates.
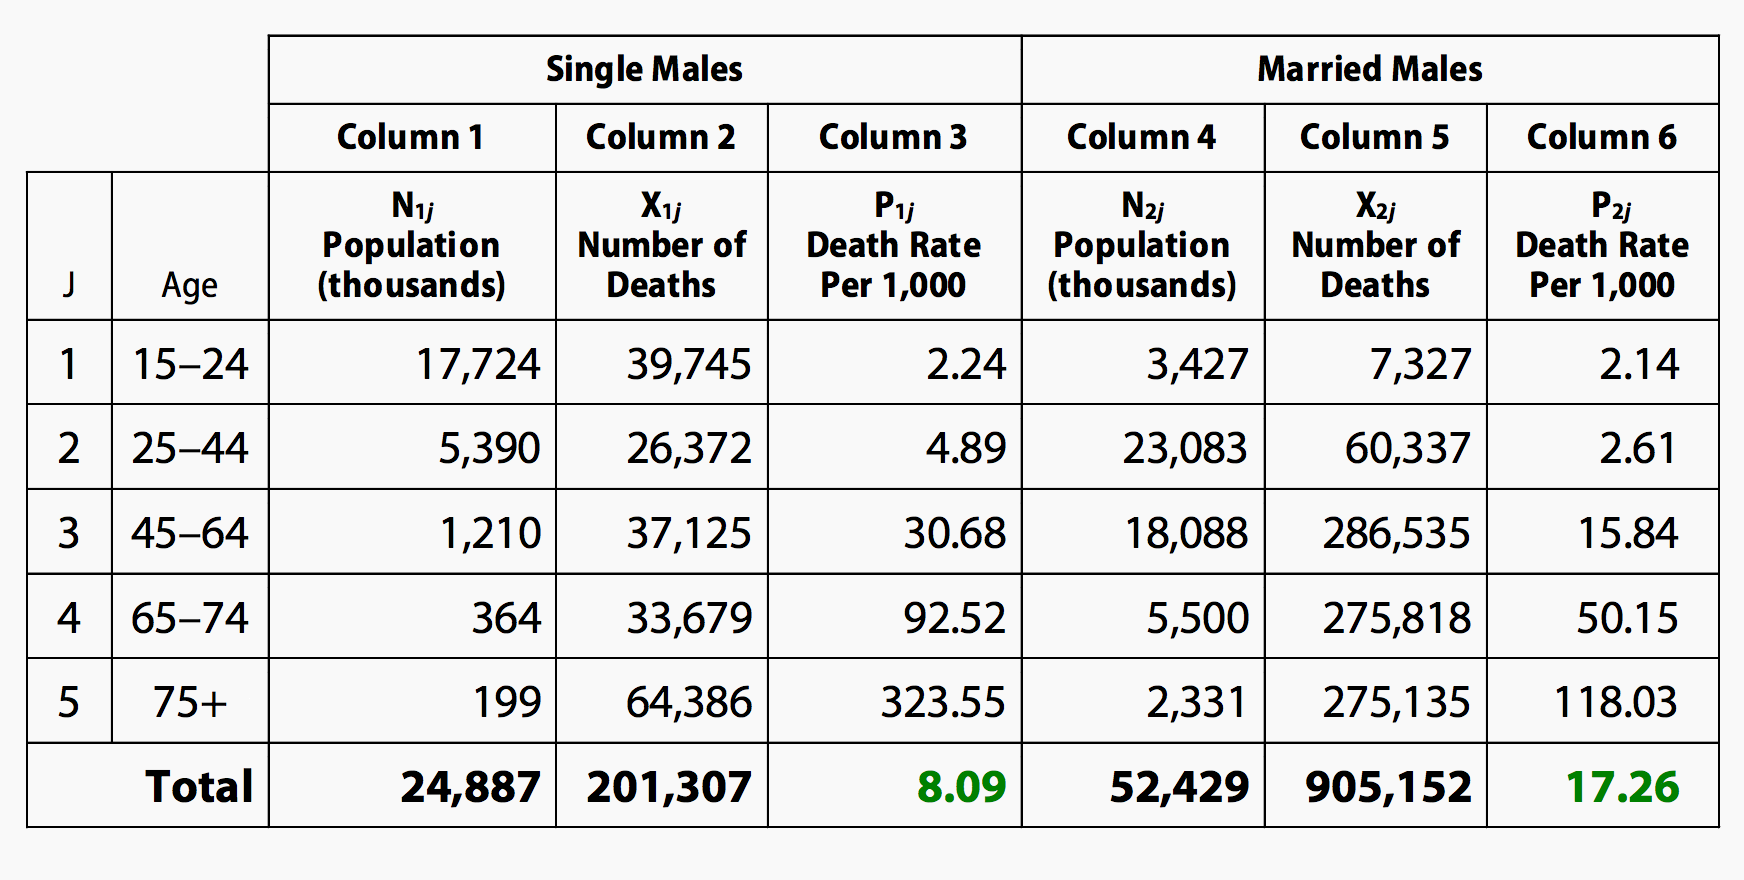
Here’s the table if you want to try calculating on your own (and then watch the video to double check your work).
Indirect Age Adjustment
Here we will use a different technique to compare mortality in two different populations, with different age distributions. Instead of using a separate, standard reference population, we’ll use one of the populations we’re already looking at as a reference.
- STEP ONE: Apply the known death rates of one population (the one we’ll use as a standard, in this example it’s the town folk) and apply it to the other population (in this example, it’s the miners). This gives us an estimated number of dead miners we’d expect to see (if they followed the same death rates as town folk).
- STEP TWO: Add up all the estimated number of deaths to get the expected/estimated/calculated number of deaths.
- STEP THREE: Divide the actual number of dead miners (observed) by this calculated number of dead miners (estimated) to get the standardized mortality ratio.
- STEP FOUR: You can multiply this SMR by the reference population’s crude mortality rate (the town folk’s crude mortality rate) to get an indirect adjusted mortality rate for the miners.
Here’s the table used in the video if you’d like to try the calculations on your own and see if you get the same numbers.

